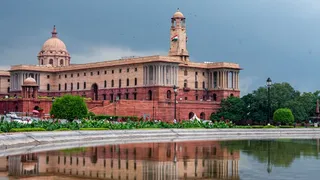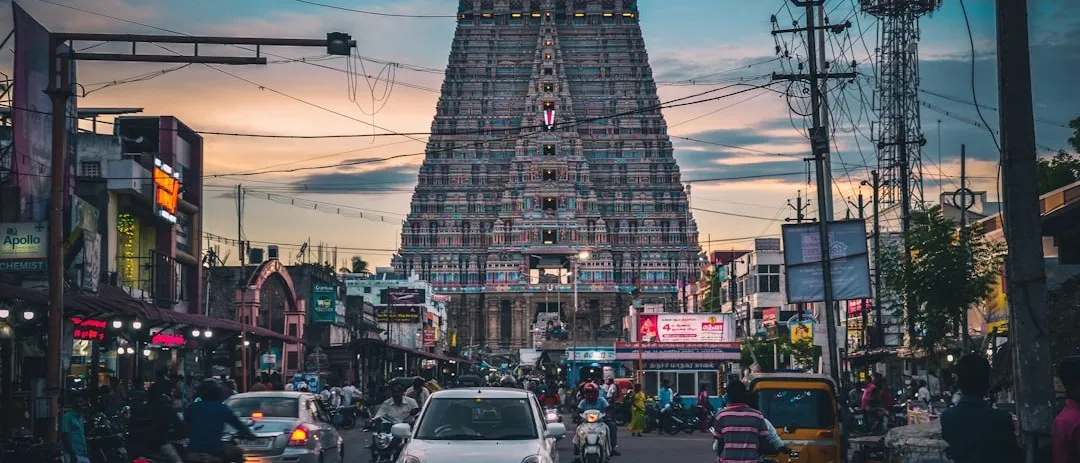
This comparative analysis examines the development trajectories of Tamil Nadu under the DMK government (2021-2025) and Gujarat under the BJP government, moving beyond simple GDP comparisons to assess progress across economic growth, social welfare, health, education, infrastructure, employment, innovation, and environmental sustainability. Both states represent distinct development models—Tamil Nadu’s inclusive, welfare-oriented approach versus Gujarat’s industry-focused growth strategy—offering important insights into effective governance in India.12
Economic Performance: Size, Growth, and Prosperity
Gross State Domestic Product and Growth
Tamil Nadu has emerged as India’s second-largest state economy with a Gross State Domestic Product (GSDP) of ₹27.2 lakh crore (approximately $329 billion) in 2023-24, surpassing Gujarat’s ₹24.2 lakh crore ($285 billion). More significantly, Tamil Nadu recorded the highest real GDP growth rate among all Indian states at 9.69% in 2024-25, compared to Gujarat’s estimated 7.5%. This represents Tamil Nadu’s highest growth rate in a decade and marks a dramatic improvement from the previous AIADMK regime (2016-21), which averaged just 4.42% growth compared to the DMK government’s 8.15% average between 2021-25.13
 A comprehensive comparison of development indicators between DMK-governed Tamil Nadu and BJP-governed Gujarat across economic, social, industrial, and innovation metrics (2023-25 data)
The nominal growth rate further illustrates Tamil Nadu’s economic momentum. At 14.02% for 2024-25, Tamil Nadu’s expansion significantly outpaced Gujarat’s lower nominal growth. This acceleration reflects not just recovery from the COVID-19 pandemic but also the effectiveness of targeted industrial policies, infrastructure investments, and welfare schemes implemented by the DMK government since 2021.13
Per Capita Income and Wealth Distribution
Tamil Nadu’s per capita income reached ₹3.53 lakh in 2023-24, exceeding Gujarat’s ₹3.36 lakh. More importantly, this represents 1.6 times the national average of ₹1.69 lakh, ranking Tamil Nadu fourth among Indian states. Between 2020-21 and 2024-25, Tamil Nadu’s per capita income surged from ₹1.43 lakh to ₹1.96 lakh, reflecting an impressive 83.3% growth over the decade compared to the national average of 57%.14
The distribution of this wealth reveals a critical distinction. Tamil Nadu’s poverty rate stands at just 5.8% according to World Bank criteria (₹1,059 per month in rural areas and ₹1,286 in urban areas), while Gujarat’s poverty rate ranges between 21.8% and 27.4%. In absolute numbers, over 168 lakh (16.8 million) people in Gujarat live below the poverty line—approximately one-third of the state’s population. This stark contrast indicates that while Gujarat has achieved substantial industrial growth, the benefits have not translated into broad-based poverty reduction as effectively as in Tamil Nadu.56
Economic Diversification and Resilience
Tamil Nadu’s economic strength lies in its diversified industrial base spanning automobiles and electric vehicles (Chennai), textiles and garments (Tirupur, Coimbatore), information technology and software services (Chennai, Trichy, Coimbatore), renewable energy, and heavy infrastructure. This diversity provides stability and reduces vulnerability to sector-specific downturns.1
Gujarat’s economy, while substantial, remains more concentrated in traditional industries: oil and gas, petrochemicals, gems and jewelry, and pharmaceuticals. This industrial concentration makes Gujarat more susceptible to commodity price fluctuations and global market shifts. Tamil Nadu’s export profile further demonstrates this advantage—the state exports software and engineering services to over 220 countries, building a digital, global economy, while Gujarat’s exports remain heavily dependent on petrochemicals and pharmaceuticals.2
Social Development: Health, Education, and Human Capital
Health Outcomes: Maternal and Child Mortality
Tamil Nadu has consistently outperformed Gujarat on critical health indicators. The state’s Infant Mortality Rate (IMR) stands at 15-17 per 1,000 live births, significantly lower than Gujarat’s 23-25. Tamil Nadu’s IMR has declined dramatically from 57 in the early 1990s to its current level, representing one of the most successful public health transformations in India.78
The Maternal Mortality Ratio (MMR) reveals an even more pronounced gap. Tamil Nadu achieved an MMR of 60 per 100,000 live births (with some recent data showing 52 in 2022-23), compared to Gujarat’s 75. Tamil Nadu’s near-universal institutional delivery rate of 99% versus Gujarat’s 86.5% partially explains this difference. The state’s comprehensive maternal health infrastructure, including the pioneering Maternal Death Audit system established in 1994 and mandatory reporting of all maternal deaths within 24 hours, has created a robust accountability framework.91011
The Under-Five Mortality Rate similarly favors Tamil Nadu at 20 per 1,000 live births versus the national average of 42, reflecting better pediatric care and public health initiatives. Tamil Nadu’s Total Fertility Rate of 1.7 is also lower than the national average of 2.0, indicating more effective family planning and women’s empowerment.7
Education and Literacy
Tamil Nadu’s literacy rate of 82% surpasses Gujarat’s 78% and the national average of 73%. This educational advantage translates into a more skilled workforce capable of participating in knowledge-intensive industries. The gap becomes more significant when examining urban versus rural literacy—Tamil Nadu demonstrates strong performance across both demographics, with rural literacy at 73.5% and urban literacy at 87%.11213
Tamil Nadu’s educational infrastructure extends beyond basic literacy. The state’s Gross Enrollment Ratio (GER) at secondary and higher secondary levels exceeds national averages, though challenges remain in reducing dropout rates between secondary and senior secondary levels. The DMK government’s welfare schemes—including the Pudhumai Penn Scheme (₹1,000 monthly for female college students) and Tamil Pudhalvan Scheme for male students—have directly addressed affordability barriers to higher education.1415
Nutrition and Child Development
Gujarat faces significant challenges in child nutrition despite its economic growth. According to NFHS-5 data, 39% of children under five in Gujarat are stunted, with the rate increasing slightly from 38.5% in NFHS-4. Severe wasting affects 10.6% of children, up from 9.5% in the previous survey. The most affected districts include Dahod (55.3% stunting), Patan (50.5%), and Chotta Udepur (48.6%).16
Tamil Nadu has performed significantly better on nutritional indicators, largely attributable to its pioneering Mid-Day Meal Scheme. Initiated by Chief Minister M.G. Ramachandran in 1982, this program has become the longest-running and most successful school feeding initiative in India, currently serving millions of children daily. The scheme provides hot, nutritious meals that include locally appropriate foods, addressing both hunger and cultural preferences. Tamil Nadu’s approach includes dedicated dining halls in government schools, centralized kitchens in urban areas for quality control, and locally prepared meals in remote tribal schools for accessibility.1718
The impact extends beyond nutrition. Tamil Nadu’s Mid-Day Meal Scheme has increased school enrollment, reduced dropout rates, and promoted social integration by having children from diverse castes and economic backgrounds share meals together. The scheme also provides employment to women as cooks and helpers, contributing to local economic empowerment.1920
Human Development Index
The Human Development Index (HDI), which combines life expectancy, education, and income, places Tamil Nadu at 0.738 compared to Gujarat’s 0.698 as of 2018 data. This positions Tamil Nadu 12th among Indian states, while Gujarat ranks 18th. Tamil Nadu’s HDI has shown consistent improvement, rising from 0.636 in 1996 to 0.657 in 2001 and 0.708 in 2017, reaching 0.751 by 2024 estimates.121
Within Tamil Nadu, Chennai leads with an HDI of 0.865, followed by Kanchipuram (0.834), Erode (0.828), Coimbatore (0.825), and Thiruvallur (0.819). Gujarat’s HDI of 0.707 as of 2011 reflects substantial rural-urban disparities, with urban areas scoring significantly higher than rural regions. The gap indicates that Gujarat’s economic growth has not translated into commensurate improvements in health and education across all population segments.2223
Infrastructure Development: Connectivity and Urbanization
Transportation and Industrial Connectivity
Tamil Nadu has systematically invested in comprehensive transportation infrastructure. The state possesses four international airports (Chennai, Madurai, Coimbatore, and Trichy), with Chennai Airport ranking as India’s third-busiest for cargo movement with a capacity to handle 1.1 million tonnes annually. A new greenfield airport capable of handling 40 million passengers annually has been proposed to meet growing demand.24
The state’s port infrastructure includes four large seaports (Chennai, Kamarajar, V.O.C., and Kattupalli), along with Karaikal port, providing a combined container handling capacity of 5.5 million TEU (Twenty-foot Equivalent Units) annually. Since 2021, Tamil Nadu has completed over 2,100 km of roads and nearly 1,000 bridges. Major industrial corridors under development include the Chennai-Bengaluru Industrial Corridor (CBIC), Chennai-Kanniyakumari Industrial Corridor (CKIC) covering 23 districts, and the Tamil Nadu Defence Industrial Corridor covering five nodal cities.25
Gujarat has also invested heavily in infrastructure, particularly through mega-projects. The state is developing the Dholera Special Investment Region (SIR), India’s largest greenfield smart city spanning 422 sq km. The Delhi-Mumbai Industrial Corridor (DMIC) passes through Gujarat for 565 km (36% of the total corridor), connecting major cities like Ahmedabad, Vadodara, and Surat. Gujarat’s ports infrastructure includes Kandla, Mundra, Pipavav, Dahej, and Hazira, strategically positioned for coastal economic zones.26
The Ahmedabad-Mumbai High Speed Rail (bullet train) project represents a major connectivity initiative with an estimated cost of $9.7 billion. However, the practical impact on broad-based development remains to be seen, as such prestige projects primarily benefit urban elites rather than addressing rural connectivity challenges.2728
Urbanization and Urban Development
Tamil Nadu stands as India’s most urbanized large state with 48.4% of its population residing in urban areas according to the 2011 census, far exceeding the national average of 27.82%. Projections suggest urbanization will reach 60-67% by 2031. This urbanization has been accompanied by planned development, with the state implementing comprehensive urban infrastructure projects including the Chennai Metro, improved water supply systems, and sustainable urban housing.2930
Gujarat’s urbanization rate is lower than Tamil Nadu’s, though the state has undertaken significant urban development initiatives. The government declared 2025 as the “Urban Development Year,” marking 20 years since the initial Urban Development Year launched in 2005. Major projects include the development of Gandhinagar as a smart city, the Sabarmati Riverfront in Ahmedabad, and sanction of ₹8,220 crore for various urban infrastructure projects.27
However, Gujarat’s urban development has faced criticism for prioritizing showcase projects over equitable service delivery. Tamil Nadu’s approach, while less marketed, has focused on practical improvements in housing, sanitation, water supply, and public transportation that benefit a broader segment of the urban population.12
Employment and Industrial Growth
Job Creation and Industrial Employment
Tamil Nadu leads India in industrial employment, accounting for 15.24% of all factory workers in the country despite having only 5-6% of India’s population. According to the Annual Survey of Industries 2023-24, Tamil Nadu hosts over 40,100 factories, representing 15.43% of the national total. This translates to nearly one in every six factory workers in India being employed in Tamil Nadu.31
Between 2021 and 2025, the DMK government has attracted investment proposals worth ₹10.14 lakh crore through 893-895 MoUs, creating approximately 31-32 lakh employment opportunities. According to Employee Provident Fund (EPF) statistics, Tamil Nadu generates 12.5 lakh jobs per year, amounting to about 52 lakh jobs over the last four years.3231
Gujarat’s share of industrial employment stands at 12.7% of the national total. While substantial, this lags behind Tamil Nadu both in absolute numbers and growth trajectory. The quality and sustainability of employment also differs—Tamil Nadu’s focus on manufacturing diversity, including high-value electronics and automotive sectors, creates more stable, long-term employment compared to Gujarat’s concentration in capital-intensive petrochemicals and oil refining, which generate fewer jobs per unit of investment.131
Women’s Workforce Participation
Tamil Nadu has achieved remarkable success in women’s workforce participation. According to the 2021-22 Annual Survey of Industries, of India’s 14.9 lakh registered women factory workers, 6.3 lakh (42%) are employed in Tamil Nadu. Women’s participation in service and manufacturing sectors stands at 64% in Tamil Nadu, far exceeding the national average of 43%, Gujarat’s 44%, and Maharashtra’s 35%.33
The Female Labour Force Participation Rate (FLFPR) for women aged 15-59 years increased from 40% in 2018-19 to 44% in 2023-24 in Tamil Nadu, compared to the national average of 32.5-40%. Unlike many states where increased female participation reflects distress-driven agricultural labor, Tamil Nadu women predominantly work in organized manufacturing and service sectors.34
Several policy interventions support this achievement. The Thozhi hostels, a public-private partnership providing safe, affordable housing near industrial centers, accommodate over 2,000 women across 10 facilities. Night-shift approvals for women, training subsidies, creche facilities in industrial parks, and the state’s high female literacy rate of 73.4% have created an enabling ecosystem. Additionally, 92.2% of women in Tamil Nadu have bank accounts and 74.6% own mobile phones, compared to national averages of 78.6% and 54% respectively, indicating greater financial inclusion and autonomy.33
Gujarat’s share of women in factory employment stands at just 6.8% according to 2019-20 data, significantly lower than Tamil Nadu’s 41-42%. This disparity reflects both sectoral differences (Gujarat’s capital-intensive industries employ fewer women) and potentially less supportive social infrastructure for women workers.33
Innovation, Startups, and Knowledge Economy
Startup Ecosystem Development
Tamil Nadu has rapidly emerged as a major startup hub, with over 12,000 DPIIT-registered startups as of 2024-25, a six-fold increase from approximately 2,000 when StartupTN was established in 2021. This growth represents a compound annual growth rate of 36%. The state’s startup ecosystem is valued at $28 billion and expanding at 23% annually.3536
More than 50% of Tamil Nadu’s startups (approximately 6,000+) are women-led, collectively raising over $250 million. This represents one of the highest shares of women-led ventures in India, reflecting the state’s success in promoting inclusive entrepreneurship. Chennai serves as both the SaaS capital of India and its third-largest deeptech hub, driving innovation in artificial intelligence, robotics, semiconductors, and advanced hardware.135
Tamil Nadu startups have raised $4.2 billion since 2016, led by SaaS, fintech, and advanced hardware ventures. The state leads India in patent filings with 7,686 patents in FY23, representing 17% of the national total. This innovation capacity reflects the strong linkage between Tamil Nadu’s educational institutions, research facilities, and industry.37
Gujarat’s startup ecosystem, while growing, lacks comparable publicly available metrics. The state has focused more on large-scale industrial investments through initiatives like Vibrant Gujarat summits rather than nurturing a broad-based startup culture. This difference in approach reflects the two states’ distinct development philosophies—Tamil Nadu’s emphasis on human capital and knowledge-based growth versus Gujarat’s focus on attracting large capital-intensive projects.38
Policy Support for Innovation
Tamil Nadu’s Startup and Innovation Policy 2023 aims to facilitate the establishment of 15,000 startups across various sectors and regions, elevate Tamil Nadu to one of the top three startup ecosystems in India, and ensure balanced growth in Tier II and III cities. The revamped Tamil Nadu Startup Seed Fund (TANSEED) provides equity-linked grants to early-stage startups.39
The state has established FabLabs at government engineering colleges in Salem, Tirunelveli, and Trichy to support prototype development and testing. The StartupTN Co-Creation Fund and dedicated sector-specific policies for semiconductors, defence, fintech, R&D, and Global Capability Centers provide tailored support. In August 2024 alone, StartupTN facilitated startups to raise $9.6 million through its partner network of 200+ venture capital firms.3739
Gujarat’s innovation support primarily flows through industrial parks and SEZs rather than a comprehensive startup-focused policy framework. The state’s emphasis remains on attracting established companies through investment summits and incentives rather than nurturing early-stage ventures.40
Renewable Energy and Environmental Sustainability
Solar and Wind Power Capacity
Tamil Nadu has established itself as a renewable energy leader. As of January 2024, the state possesses 7,426 MW of installed solar capacity (fourth-highest in India) and 10,441 MW of wind capacity (second-highest in India). Combined, Tamil Nadu has over 20 GW of installed renewable capacity.4142
The state has set ambitious targets to add 10,000 MW of solar energy and 2,000 MW of wind power over the next five years, aiming to increase renewable energy’s share in generation to 50% by 2030. On September 10, 2023, Tamil Nadu achieved a record wind power generation of 5,838 MW, and on April 23, 2024, set a record for the highest single-day solar energy generation at 40.50 MU.4341
Tamil Nadu’s renewable energy expansion includes Battery Energy Storage Systems (BESS) to address intermittency, with proposals for 4,000 MW solar capacity supported by 2,000 MW battery storage in the first phase. The state’s distributed energy resources (DER) potential is estimated at 1,29,166 MW, including 60,479 MW of rooftop solar potential, though only 0.78% of total DER potential has been realized as of April 2025.44
Gujarat has been a renewable energy pioneer, contributing approximately 12% of India’s renewable energy basket. The state has an installed wind capacity of 12,132 GW (25.77% of India’s total) as of July 2024, making it India’s second-largest producer of wind power. Gujarat’s installed solar capacity stood at 5,607 MW as of 2019.45
The state is developing the Gujarat Hybrid Renewable Energy Park (Khavda Solar Park) near Vighakot village in Kutch district, slated to become the world’s largest hybrid renewable energy park spanning 72,600 hectares. Expected to generate 30 GW from solar and wind, the park will power 18 million homes and create 100,000 jobs while attracting ₹150,000 crore ($18 billion) in investment. As of August 2025, approximately 2.8 GW capacity has been commissioned.46
While both states have made significant renewable energy investments, Tamil Nadu’s integrated approach combining generation expansion with storage solutions and grid modernization appears more comprehensive. Gujarat’s mega-park approach, while impressive in scale, concentrates development in a single location rather than distributing benefits across the state.41
Welfare Schemes and Social Security
Comprehensive Social Protection
Tamil Nadu’s welfare architecture represents one of India’s most comprehensive social protection systems. The Kalaignar Mahalir Urimai Thittam, launched by the DMK government, provides ₹1,000 monthly to 1.15 crore women-headed families. Studies commissioned by the State Planning Commission indicate this scheme has resulted in average household savings of ₹888 per month and improved women’s workforce participation.47
The Chief Minister’s Thayumanavar Scheme aims to uplift 5 lakh of the poorest families to launch a “final assault on poverty”. The Innuyir Kappom emergency medical response initiative provides immediate healthcare, while Makkalai Thedi Maruthuvam brings healthcare services to people’s doorsteps, having benefited 2 crore people.48
Tamil Nadu’s housing support has increased six-fold under the DMK government, with the unit cost rising from ₹58,400 to ₹3.50 lakh per house, reflecting genuine commitment to poverty alleviation. This contrasts sharply with the central government’s Pradhan Mantri Awas Yojana-Grameen (PMAY-G), which has maintained a unit cost of ₹1.20 lakh since 2016 without revision.47
Gujarat implements various central welfare schemes and has achieved notable coverage in programs like Swarnim Jayanti Gram Swarojgar Yojana (458% of target), activities for generating income by Self Help Groups (1037% of target), and Antyodaya Anna Yojana (103% of target). However, the state’s persistently high poverty rate of 21.8-27.4% suggests these programs have not achieved the transformative impact seen in Tamil Nadu.4950
Public Distribution System and Food Security
Tamil Nadu’s Public Distribution System (PDS) has been consistently rated among India’s best-performing systems. The state provides subsidized rice, sugar, and other essential commodities through an extensive network of fair price shops. This universalist approach to social welfare, maintained across different political regimes, has contributed significantly to poverty reduction and food security.5
Gujarat’s PDS implementation has achieved reasonable coverage but faces challenges in reaching the most vulnerable populations, particularly tribal communities in districts like Dahod, The Dangs, and Chotta Udepur. The persistence of high malnutrition rates despite economic growth suggests gaps in the social safety net.16
Challenges and Areas for Improvement
Tamil Nadu’s Challenges
Despite impressive progress, Tamil Nadu faces several challenges. The DMK government promised to create 5.5 lakh government jobs over five years, along with filling 3.5 lakh vacant positions, but progress on this commitment has been questioned by opposition parties. Corruption allegations against some DMK ministers, including the removal of two ministers over various charges, have damaged the party’s reputation.51
Unemployment, particularly among educated youth, remains a concern. While Tamil Nadu’s unemployment rate of 4.3% in 2022-23 is above the national average, the state’s Labor Force Participation Rate for individuals aged 15-59 rose to 64.6% in 2023-24, surpassing the national average of 64.3%. The challenge lies in creating sufficient high-quality jobs to match the aspirations of Tamil Nadu’s highly educated workforce.52.pdf)3
Infrastructure constraints in major cities, particularly Chennai, include traffic congestion, water scarcity (exemplified by the 2019 “Day Zero” crisis), and inadequate waste management facilities generating 15,000 tonnes of waste daily. The state must balance rapid urbanization with sustainable infrastructure development and environmental protection.53
Gujarat’s Challenges
Gujarat’s most significant challenge lies in translating economic growth into broad-based human development. Despite ranking sixth in per capita income, the state ranks 18th on the Human Development Index, indicating a concerning disconnect between wealth generation and social outcomes. This gap is particularly pronounced in health and education indicators, where Gujarat performs closer to states like Bihar than to development leaders like Kerala or Tamil Nadu.3821
Child malnutrition rates remain stubbornly high, with 39% of children under five stunted and 10.6% severely wasted. The increase in stunting from 38.5% to 39% between NFHS-4 and NFHS-5 is particularly concerning. Tribal districts show especially poor outcomes, with Dahod recording 55.3% stunting among children under five.16
Gujarat’s rising poverty is reflected in the increasing number of families classified as Below Poverty Line. Between 2020-21 and 2022-23, over 3,000 families slipped into poverty while fewer than 20 moved out. With 31.61 lakh BPL families (approximately 1.89 crore individuals), one-third of Gujarat’s population lives below the poverty line.6
Gender indicators also show concerning trends. Women’s workforce participation in Gujarat’s factory sector stands at just 6.8%, among the lowest of major industrial states. This suggests that Gujarat’s industrial growth has not been as inclusive or employment-generating as Tamil Nadu’s manufacturing-led development.33
The Two Development Models: A Critical Assessment
Tamil Nadu’s Inclusive Growth Model
Tamil Nadu’s development approach reflects what scholars have termed the “Dravidian Model”—a governance philosophy emphasizing social justice, education, public health, and welfare distribution alongside economic growth. This model prioritizes:52
- Universal welfare schemes that provide direct benefits to large sections of the population, such as free bus transport for women, monthly cash transfers, educational scholarships, and subsidized housing.5455
- Strong public health and education infrastructure built over decades, creating a foundation for human capital development that supports economic productivity.756
- Employment-generating industrialization focused on labor-intensive manufacturing sectors (textiles, automotive, electronics) rather than capital-intensive heavy industries.32
- Social inclusion mechanisms like the Mid-Day Meal Scheme that break down caste barriers and promote equal opportunity.17
- Women’s empowerment through targeted policies for education, employment, financial inclusion, and safety.4734
The model’s effectiveness is evident in Tamil Nadu’s poverty reduction from approximately 14.96% to 5.8%, while maintaining high growth rates. The state has demonstrated that rapid economic expansion need not come at the cost of social development—indeed, investments in health, education, and welfare appear to have created a virtuous cycle supporting sustained growth.1
Gujarat’s Growth-Centric Model
Gujarat’s development strategy reflects the “Gujarat Model” championed during Narendra Modi’s tenure as Chief Minister (2001-2014) and continued under subsequent BJP governments. This approach emphasizes:
- Business-friendly policies aimed at attracting large-scale private investment through streamlined approvals, infrastructure development, and tax incentives.26
- Mega-infrastructure projects like the bullet train, GIFT City, and Dholera SIR that showcase modern development but primarily benefit urban elites.28
- Industrial corridors and Special Economic Zones creating manufacturing hubs with world-class facilities.26
- Extensive marketing through “Vibrant Gujarat” summits that have successfully positioned the state as India’s premier investment destination.1
- Public-private partnerships in infrastructure development and urban services.26
While this model has achieved impressive industrial growth and positioned Gujarat as India’s most investor-friendly state, the benefits have not translated into commensurate improvements in human development indicators. The persistence of high poverty (21.8-27.4%), child malnutrition (39% stunting), and low human development ranking (18th) relative to economic prosperity (6th in per capita income) suggests structural weaknesses in the model.5216
Lessons and Implications
The Tamil Nadu versus Gujarat comparison offers several critical lessons for development policy:
1. Economic growth alone is insufficient. Gujarat’s experience demonstrates that high GDP growth and industrial expansion do not automatically translate into broad-based human development without complementary social investments.5
2. Welfare spending is productive investment. Tamil Nadu’s extensive welfare schemes have not impeded economic growth; rather, they appear to have enhanced human capital, created demand in the economy, and reduced social inequalities that can hinder long-term development.47
3. Employment quality matters. Tamil Nadu’s focus on labor-intensive manufacturing creates more jobs per unit of investment than Gujarat’s capital-intensive industries, providing livelihoods to a broader segment of the population.1
4. Social infrastructure compounds. Tamil Nadu’s early investments in public health, education, and social welfare have created cumulative advantages that now support both economic competitiveness and quality of life.75
5. Inclusive development is sustainable. Tamil Nadu’s lower poverty, better health outcomes, and higher educational attainment create a more stable foundation for long-term economic expansion than Gujarat’s top-heavy growth model.2
Conclusion
This comprehensive comparison reveals that Tamil Nadu under the DMK government (2021-2025) has outperformed BJP-governed Gujarat across most development dimensions. Tamil Nadu leads in GSDP size (₹27.2 lakh crore vs ₹24.2 lakh crore), GDP growth rate (9.69% vs 7.5%), per capita income (₹3.53 lakh vs ₹3.36 lakh), literacy (82% vs 78%), health outcomes (IMR 17 vs 25, MMR 60 vs 75), Human Development Index (0.738 vs 0.698), industrial employment (15.24% vs 12.7%), startup ecosystem (12,000+ vs data unavailable), and patent filings (17% of India’s total).193721
Most significantly, Tamil Nadu has achieved these outcomes while dramatically reducing poverty to 5.8% compared to Gujarat’s 21.8-27.4%, demonstrating that rapid economic growth can be inclusive and broad-based. The contrast is particularly stark in social indicators: Tamil Nadu’s near-universal institutional deliveries (99%), comprehensive Mid-Day Meal Scheme serving millions, and high female workforce participation (44%) reflect a development model that prioritizes human wellbeing alongside economic expansion.2833
Gujarat’s strengths lie in its renewable energy mega-projects, strategic port infrastructure, and success in attracting large-scale industrial investments. However, the persistence of high child malnutrition (39% stunting), low women’s industrial employment (6.8%), and increasing poverty indicates that these achievements have not translated into equitable development.264616
The comparison suggests that Tamil Nadu’s “quiet, consistent progress” focused on strengthening social infrastructure, creating quality employment, empowering women, and ensuring welfare distribution has proven more effective than Gujarat’s high-profile, investment-summit-driven approach. While Gujarat has built impressive infrastructure showcases, Tamil Nadu has built comprehensive systems for healthcare, education, social security, and economic opportunity that benefit the majority of its population.1
For policymakers across India and the developing world, the Tamil Nadu model demonstrates that inclusive development—characterized by strong public investments in health, education, and social welfare alongside pro-employment industrial policies—can achieve both rapid economic growth and substantial improvements in human development indicators. This stands in contrast to trickle-down approaches that prioritize headline growth numbers while leaving large segments of the population in poverty and poor health. The data unequivocally shows that Tamil Nadu is not just growing faster but growing better, setting a template for balanced, sustainable, and equitable development that other states would be well-advised to study and emulate.
⁂
Footnotes
-
https://www.theweekendleader.com/Headlines/2103/tamil-nadu-has-outperformed-gujarat:-study.html ↩ ↩2 ↩3 ↩4 ↩5 ↩6 ↩7 ↩8 ↩9 ↩10 ↩11 ↩12 ↩13 ↩14 ↩15
-
https://m.thewire.in/article/economy/gujarat-or-tamil-nadu-which-one-is-indias-model-state ↩ ↩2 ↩3 ↩4 ↩5 ↩6 ↩7
-
https://www.newindianexpress.com/states/tamil-nadu/2025/Jul/23/at-rs-197-lakh-tns-per-capita-income-higher-than-national-avg ↩ ↩2 ↩3
-
https://www.newindianexpress.com/states/tamil-nadu/2025/Jul/23/at-rs-197-lakh-tns-per-capita-income-higher-than-national-avg ↩
-
https://m.thewire.in/article/economy/gujarat-or-tamil-nadu-which-one-is-indias-model-state ↩ ↩2 ↩3 ↩4 ↩5 ↩6
-
https://journals.indexcopernicus.com/api/file/viewByFileId/190845 ↩ ↩2
-
https://nhsrcindia.org/sites/default/files/practice_image/HealthDossier2021/Gujarat.pdf ↩ ↩2 ↩3 ↩4
-
https://nhsrcindia.org/sites/default/files/practice_image/HealthDossier2021/Tamil%20Nadu.pdf ↩
-
https://www.ijfans.org/uploads/paper/0df3bb9f77342441401dfc0b6e2416ec.pdf ↩
-
https://www.mospi.gov.in/sites/default/files/reports_and_publication/statistical_publication/social_statistics/Chapter_3.pdf ↩
-
https://www.policybazaar.com/investment-plans/government-schemes/tamil-nadu/ ↩
-
https://www.newindianexpress.com/states/tamil-nadu/2025/Jul/23/at-rs-197-lakh-tns-per-capita-income-higher-than-national-avg ↩
-
https://www.niti.gov.in/sites/default/files/2023-02/SNP_Gujarat_draft_20210922_v2_JAG_43.pdf ↩ ↩2 ↩3 ↩4 ↩5
-
https://www.cry.org/blog/importance-of-mid-day-meal-schemes-in-schools-in-india/ ↩ ↩2
-
https://iisppr.org.in/evaluating-the-impact-of-mid-day-meal-scheme-among-tribal-children/ ↩
-
https://en.wikipedia.org/wiki/List_of_Indian_states_and_union_territories_by_Human_Development_Index ↩ ↩2 ↩3
-
https://cjp.org.in/wp-content/uploads/2017/05/GujaratReview070311.pdf ↩
-
https://www.indembassybern.gov.in/docs/1617966871Tamil_Nadu_Industrial_Policy_2021.pdf ↩
-
https://www.indembassybern.gov.in/docs/1617966871Tamil_Nadu_Industrial_Policy_2021.pdf ↩
-
https://cmogujarat.gov.in/en/latest-news/cm-reviews-11735-cr-gujarat-projects ↩ ↩2 ↩3 ↩4 ↩5
-
https://www.pmindia.gov.in/en/news_updates/pm-addresses-the-celebrations-of-20-years-of-gujarat-urban-growth-story/ ↩ ↩2
-
https://indconosaka.gov.in/pdf/VG%202019_Mega%20Projects_Sector%20Profile.pdf ↩ ↩2
-
https://www.facebook.com/groups/SBIPENSIONERSASSOCIATION/posts/25177929078565184/ ↩ ↩2 ↩3
-
https://www.facebook.com/groups/SBIPENSIONERSASSOCIATION/posts/25177929078565184/ ↩ ↩2
-
https://www.eurasiareview.com/11042025-tamil-nadus-women-workforce-a-paradox-of-progress-and-persistent-challenges-analysis/ ↩ ↩2 ↩3 ↩4 ↩5
-
https://www.eurasiareview.com/11042025-tamil-nadus-women-workforce-a-paradox-of-progress-and-persistent-challenges-analysis/ ↩ ↩2
-
https://inc42.com/reports/the-state-of-tamil-nadu-startup-ecosystem-report-2025/ ↩ ↩2
-
https://cms.tn.gov.in/cms_migrated/document/GO/msme_e_68_2023.pdf ↩
-
https://www.thehindubusinessline.com/news/deep-tech-edge-investor-push-key-to-next-big-leap-for-tamil-nadu-start-ups/article70154449.ece ↩ ↩2 ↩3
-
https://globalbiznow.com/politics/tamil-nadu-vs-gujarat-economic-growth-comparison-2025/ ↩ ↩2
-
https://cms.tn.gov.in/cms_migrated/document/GO/msme_e_68_2023.pdf ↩ ↩2
-
https://indconosaka.gov.in/pdf/VG%202019_Mega%20Projects_Sector%20Profile.pdf ↩
-
https://www.linkedin.com/pulse/driving-sustainable-energy-transformation-tamil-nadus-journey-ug9rc ↩ ↩2 ↩3
-
https://cms.tn.gov.in/cms_migrated/document/docfiles/energy_e_pn_2024_25.pdf ↩
-
https://cms.tn.gov.in/cms_migrated/document/docfiles/energy_e_pn_2024_25.pdf ↩
-
https://www.eqmagpro.com/tamil-nadu-unveils-10-gw-solar-and-2-gw-wind-expansion-to-lead-regional-clean-energy-growth-eq/ ↩
-
https://windinsider.com/2024/08/30/gujarat-25-77-share-leading-indias-wind-power-growth-by-july-2024/ ↩
-
https://en.wikipedia.org/wiki/Gujarat_Hybrid_Renewable_Energy_Park ↩ ↩2
-
https://www.tnpscthervupettagam.com/articles-detail/recent-tamil-nadu-government-schemes-%E2%80%93-part-1?cat=gk-articles ↩ ↩2 ↩3 ↩4
-
https://www.tnbudget.tn.gov.in/tnweb_files/GA_Eng_2025.pdf ↩
-
https://www.newindianexpress.com/nation/2023/Oct/03/in-gujarat-poverty-on-rise-count-of-families-using-bpl-cards-goes-up-2620399.html ↩
-
https://journals.indexcopernicus.com/api/file/viewByFileId/190845 ↩
-
https://theprint.in/politics/dmks-4-yr-report-card-a-look-at-stalin-govts-major-hits-misses-as-tamil-nadu-polls-near/2618489/ ↩
-
https://niti.gov.in/sites/default/files/2025-07/Summary-Report-Tamil-Nadu%20(1) ↩
-
https://madrasmusings.com/vol-32-no-6/growth-plans-for-the-state/ ↩
-
https://www.tnbudget.tn.gov.in/tnweb_files/GA_Eng_2025.pdf ↩
-
https://www.newindianexpress.com/states/tamil-nadu/2025/Jul/23/at-rs-197-lakh-tns-per-capita-income-higher-than-national-avg ↩
-
https://nhsrcindia.org/sites/default/files/practice_image/HealthDossier2021/Tamil%20Nadu.pdf ↩